Data & Analytics
Analytics & Reporting
Data that sits in a spreadsheet doesn't help anyone make a decision. This product turns it into dashboards and reports your team will actually look at.
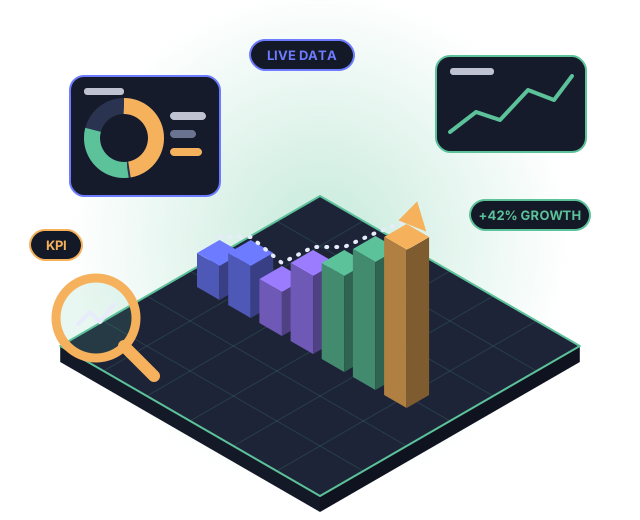
Data that sits in a spreadsheet doesn't help anyone make a decision. This product turns it into dashboards and reports your team will actually look at.
We build analytics platforms that pull data from the systems you already use — your CRM, your operations software, your finance tools — into a single, live view. Reports that used to take two days to compile become available the same day, and leadership gets visibility without waiting on a manual export.
The metrics leadership actually cares about, updated in real time.
Reports built around your specific questions, not generic templates.
Charts and views that make trends obvious at a glance.
Pull data from your existing tools into one coherent view.
Reports delivered on a schedule, without manual compilation.
Go from a high-level number down to the transactions behind it.
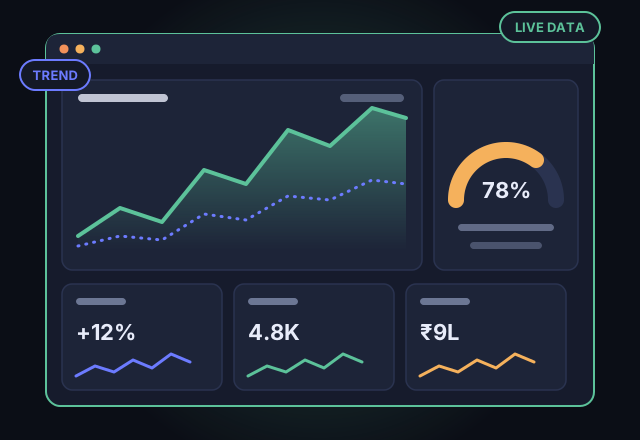
Charts and KPIs are laid out around the questions each team asks every day, with filters for date, product, branch or team.
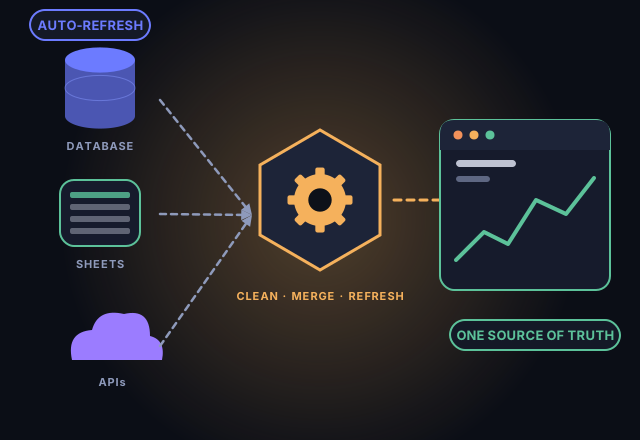
Spreadsheets, databases and business apps are connected, cleaned and refreshed automatically, so everyone looks at the same numbers.
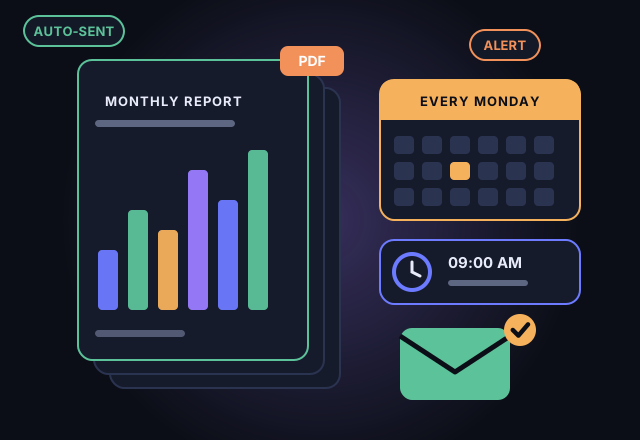
Stop building the same report every Monday. Reports are generated and sent automatically, and alerts flag numbers that need attention.
Built as a real, configurable product — not a one-off build we won't touch again.
The proven stack this product runs on, chosen for speed, security and long-term maintainability.
Automation, data processing and clean backend services.
Clear, interactive charts and dashboards.
Reliable, standards-compliant database for complex data.
Hosting, storage and managed services that scale with demand.
Tell us about your workflow — we'll show you how it maps onto this product.
Let's Talk