 SaaS · Case study
Finance & Analytics Dashboard
A decision dashboard that turns operational and financial data into clear daily signals for leadership teams.
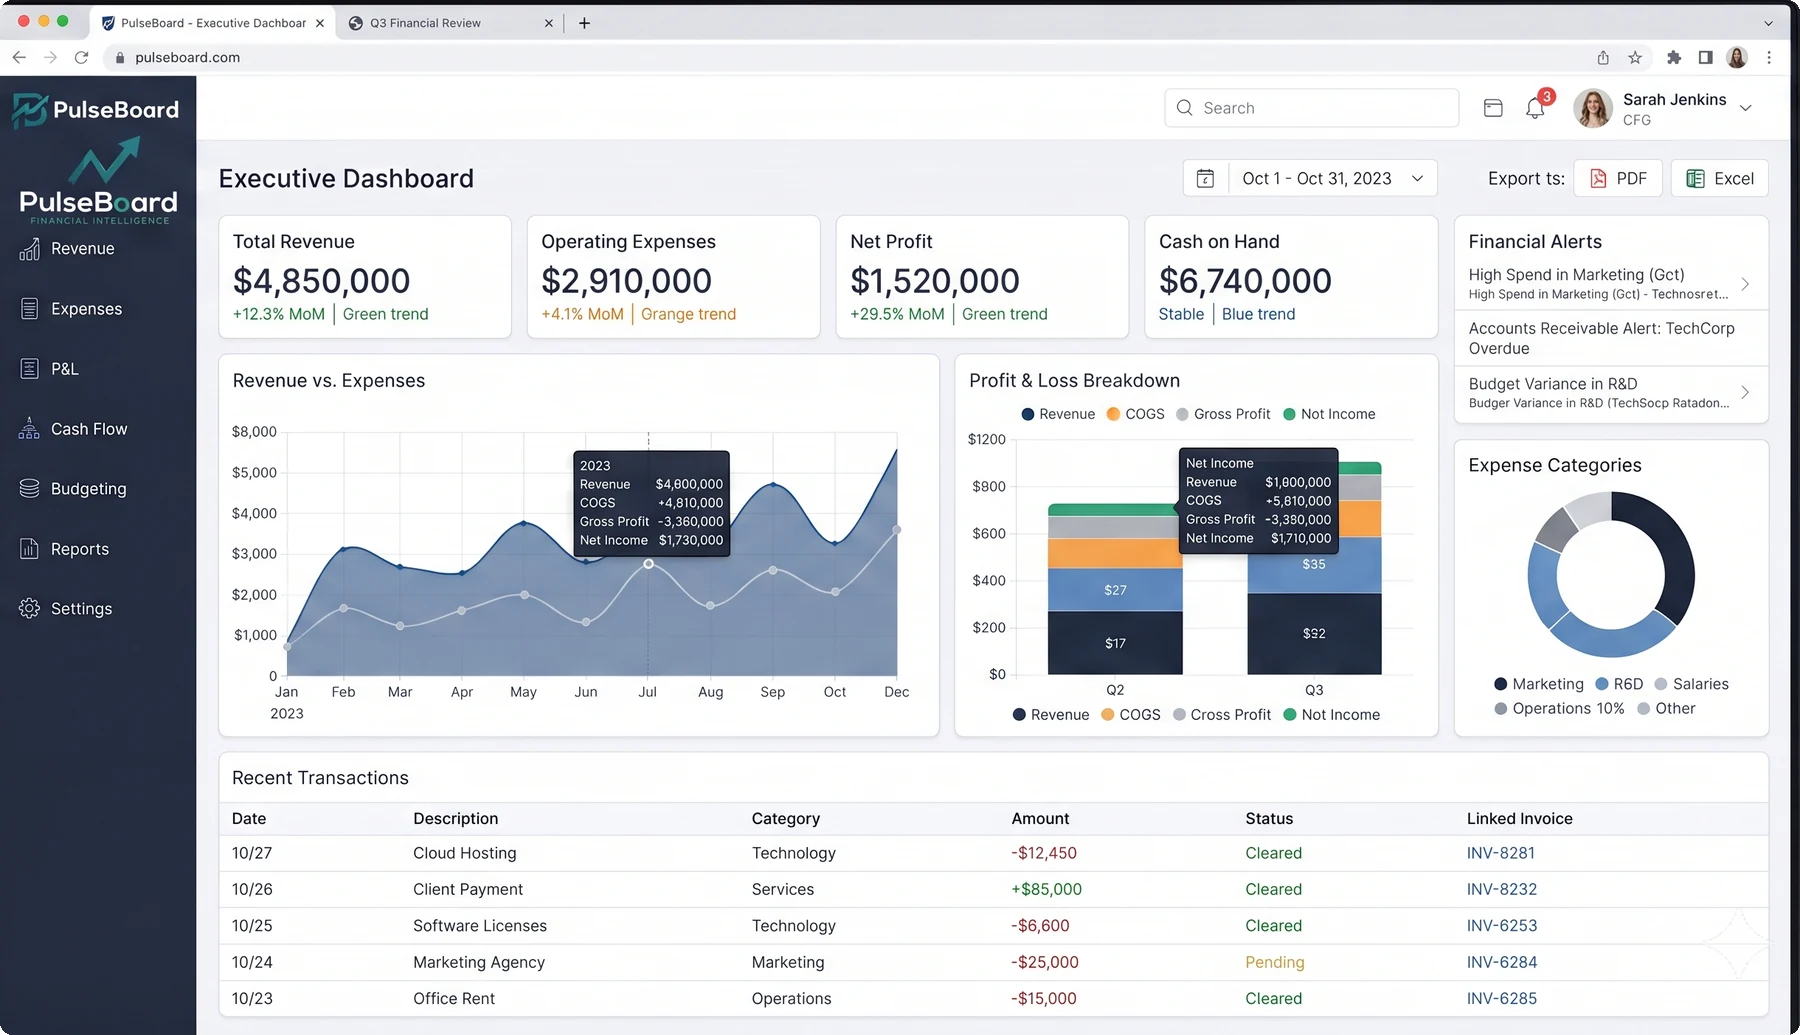
A clearer experience for a real business problem.
Leadership relied on weekly exported spreadsheets to understand financial performance, so decisions were often made on data that was already several days old.
- Bring financial data into one live dashboard
- Surface the metrics leadership actually checks daily
- Make trends easy to read at a glance
- Allow drill-down from summary to transaction level
Research, design and engineering in one delivery path.
What SARWADA built.
We built a live analytics dashboard summarizing revenue, expenses and cash flow with drill-down detail views, replacing static spreadsheet exports with a system leadership can check any time.
Everything the product needed — nothing it didn't.
Live revenue trends with period comparisons.
Category-level expense tracking.
Forward-looking cash position summary.
Move from summary metrics to transaction detail.
Build and save report views by team.
Threshold-based alerts on key metrics.
Finance, management and admin permission tiers.
Export any view to PDF or spreadsheet.
Built with a focused, production-grade stack.
Outcomes from the finished product.
Live data instead of weekly spreadsheet exports.
Key metrics visible without manual compilation.
Visual reporting replaces raw spreadsheet rows.
Drill down from summary to transaction level.
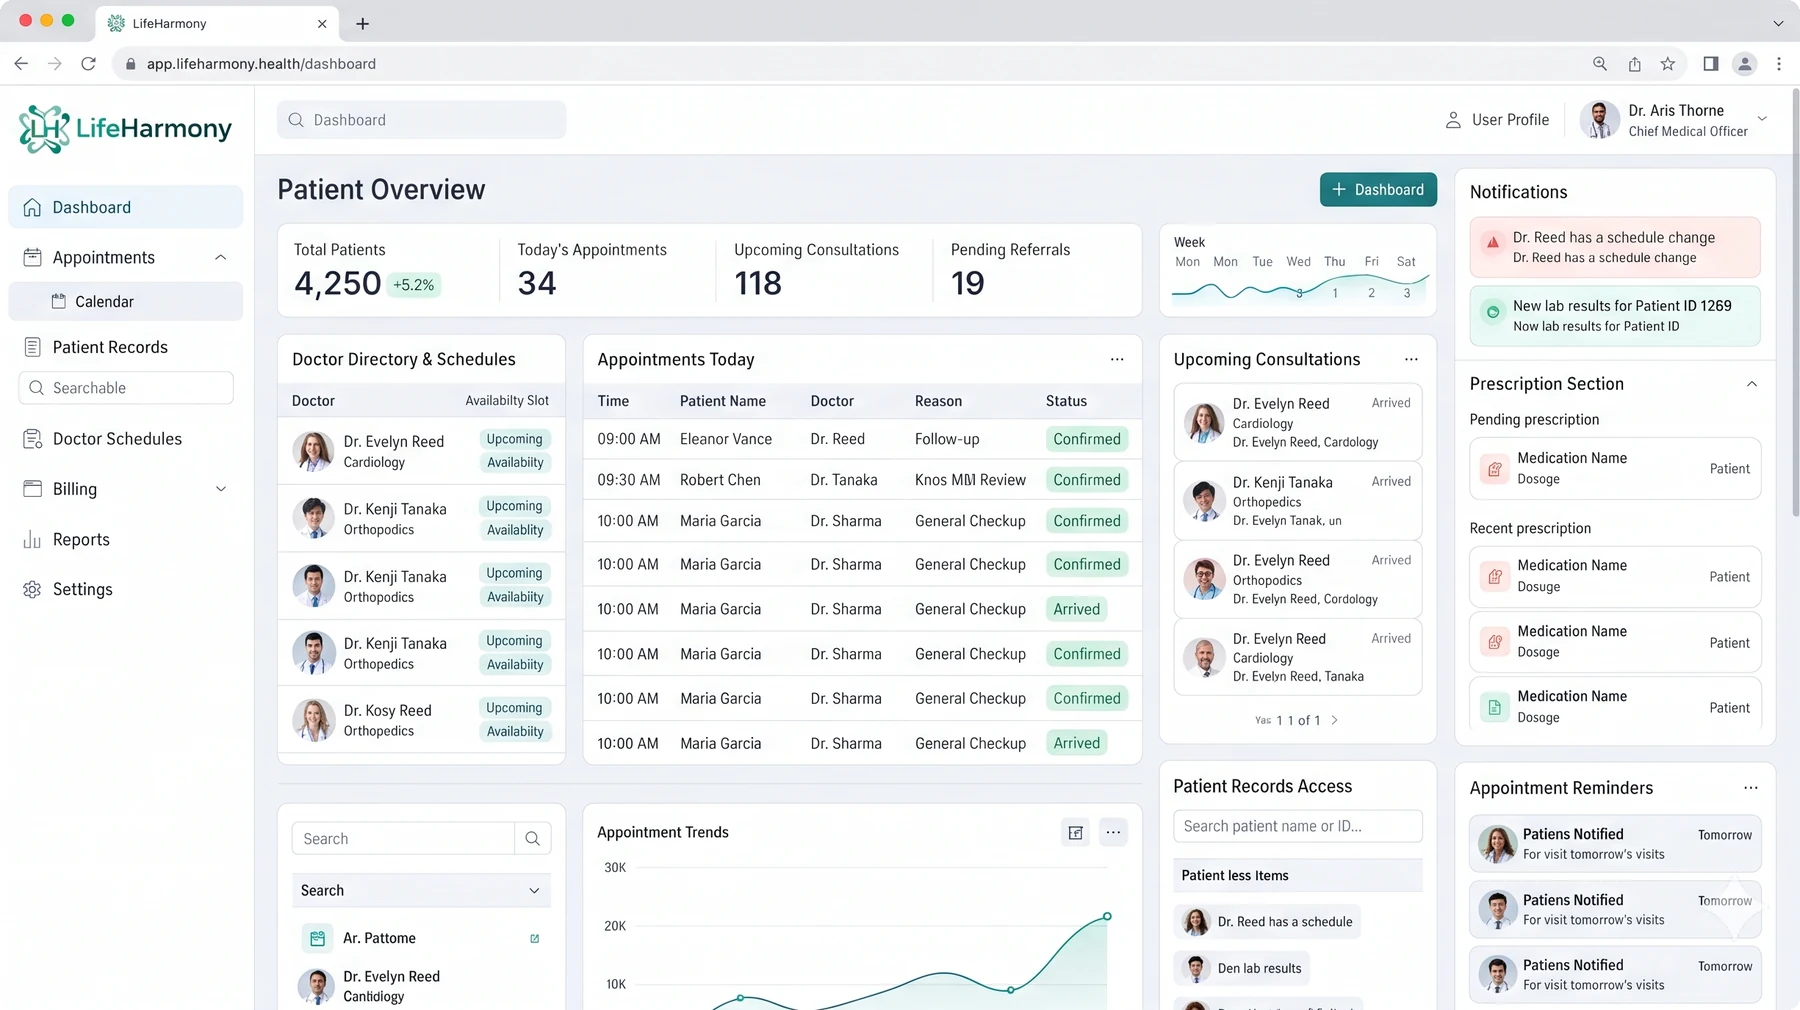
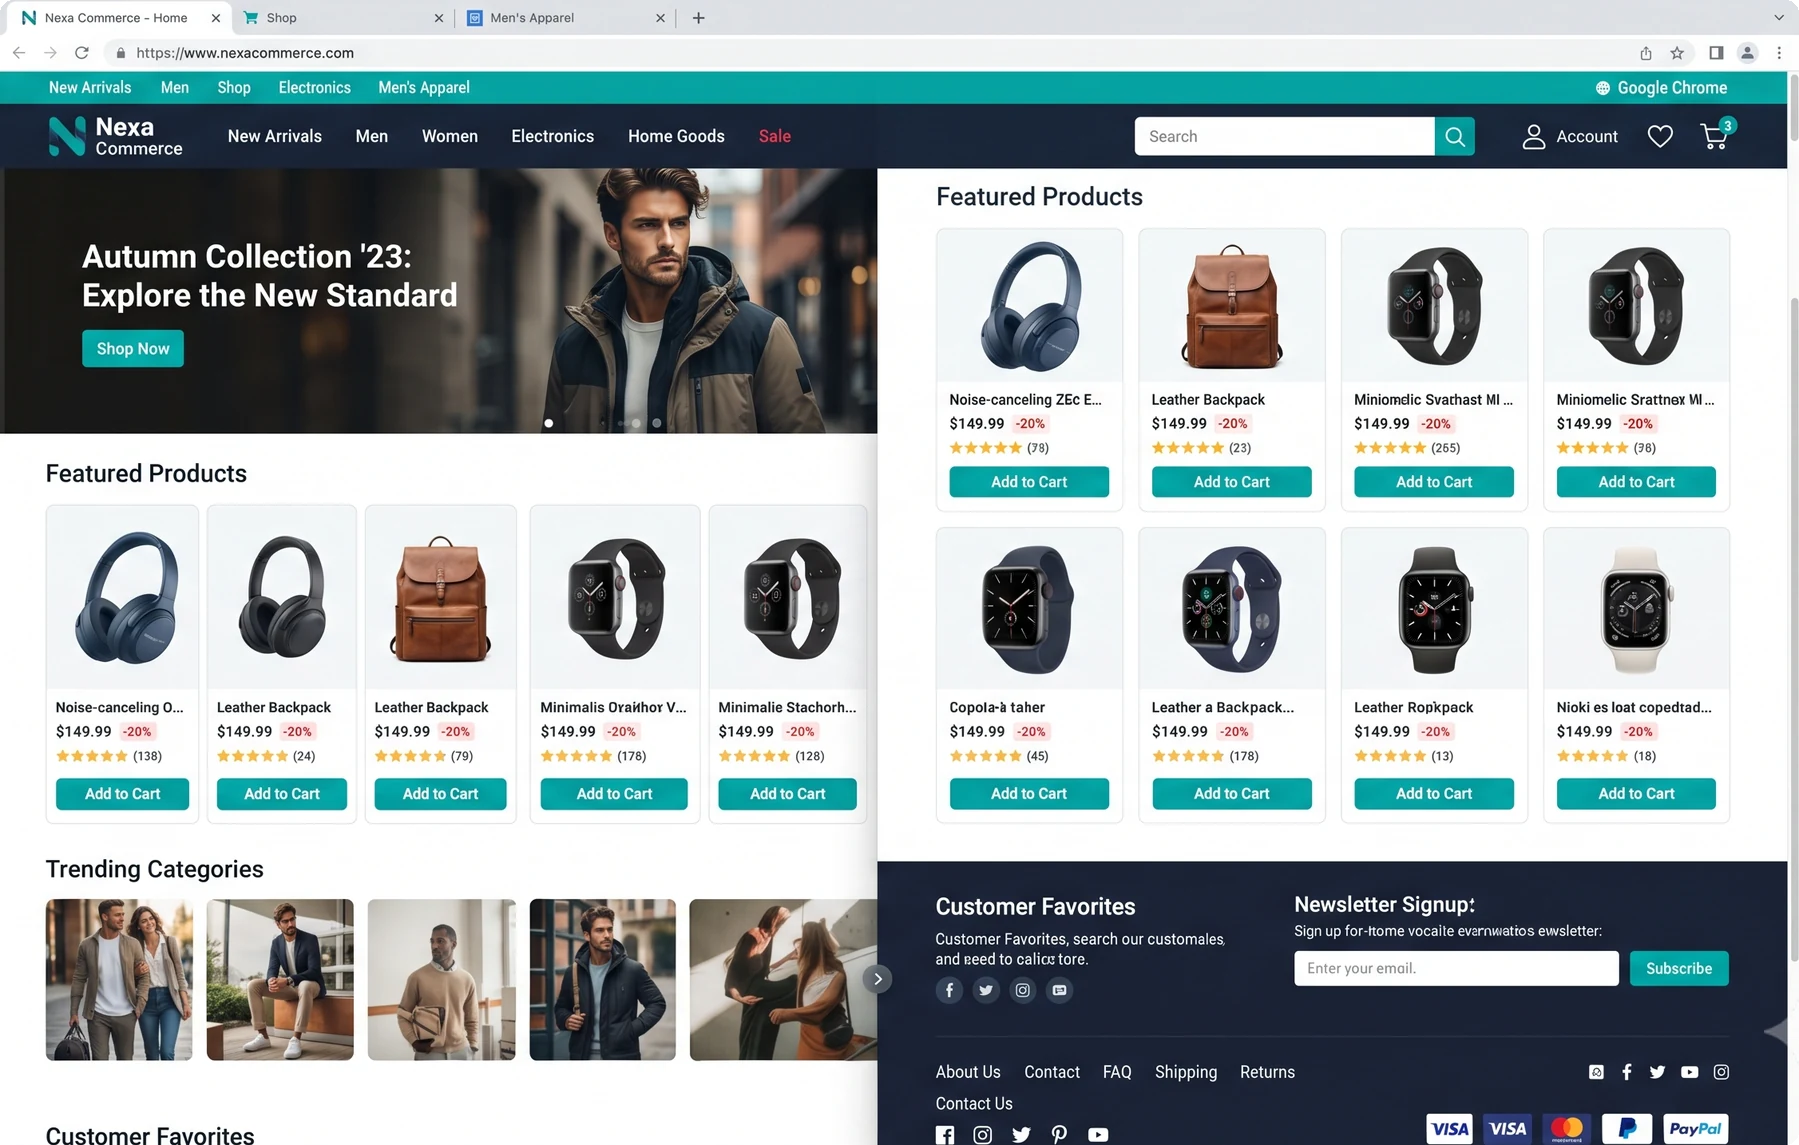
Have a product or workflow that needs a better digital experience?
Share the idea with SARWADA and we'll help turn the requirements into a practical product direction.